It's been 14 years since TradingView began operation as a web-based charting and social networking platform. Today, the platform is widely considered #1 by investors for technical analysis and market research. This article highlights five powerful crypto indicators on TradingView that can help you make smarter trading decisions in 2025.
5 TradingView Indicators To Apply to Crypto Trading
Irrespective of your status as a trader/investor, applying indicators is necessary to increase the probability of a successful trade. Although all indicators have the same goal, some are more efficient and easier to use. These are the five top indicators you can use on Tradingview Singapore today.
- MACD (Moving Average Convergence Divergence)
- Crypto Heat Map
- Crypto Screener
- Pivot Points High Low
- Volume Footprint Delta.
These tools were chosen based on their effectiveness and customizability. They also encourage community support for new and pro crypto traders.
MACD (Moving Average Convergence Divergence)
This indicator operates based on the market's momentum. Using it lets you identify trend direction and potential reversals. MACD is widely used for its ability to adapt to the volatile movements of the crypto market.
How to Set Up MACD
- Add the Indicator: Use the TradingView indicator library search function to find “MACD.” Click to add it to your trading chart.
- Customize the indicator: The most used setting for crypto traders is a Fast Length of 3, Slow Length of 10, and Signal Smoothing of 16. This setup is excellent for quicker signals and increased responsiveness to price changes.
- Timeframe: With your MACD customized, choose the 15-minute or 1-hour charts. This way, you can effectively study short-term and swing trades.
Once the MACD line crosses above the signal line, place a buy order. If it drops below the line, you should sell your crypto tokens.
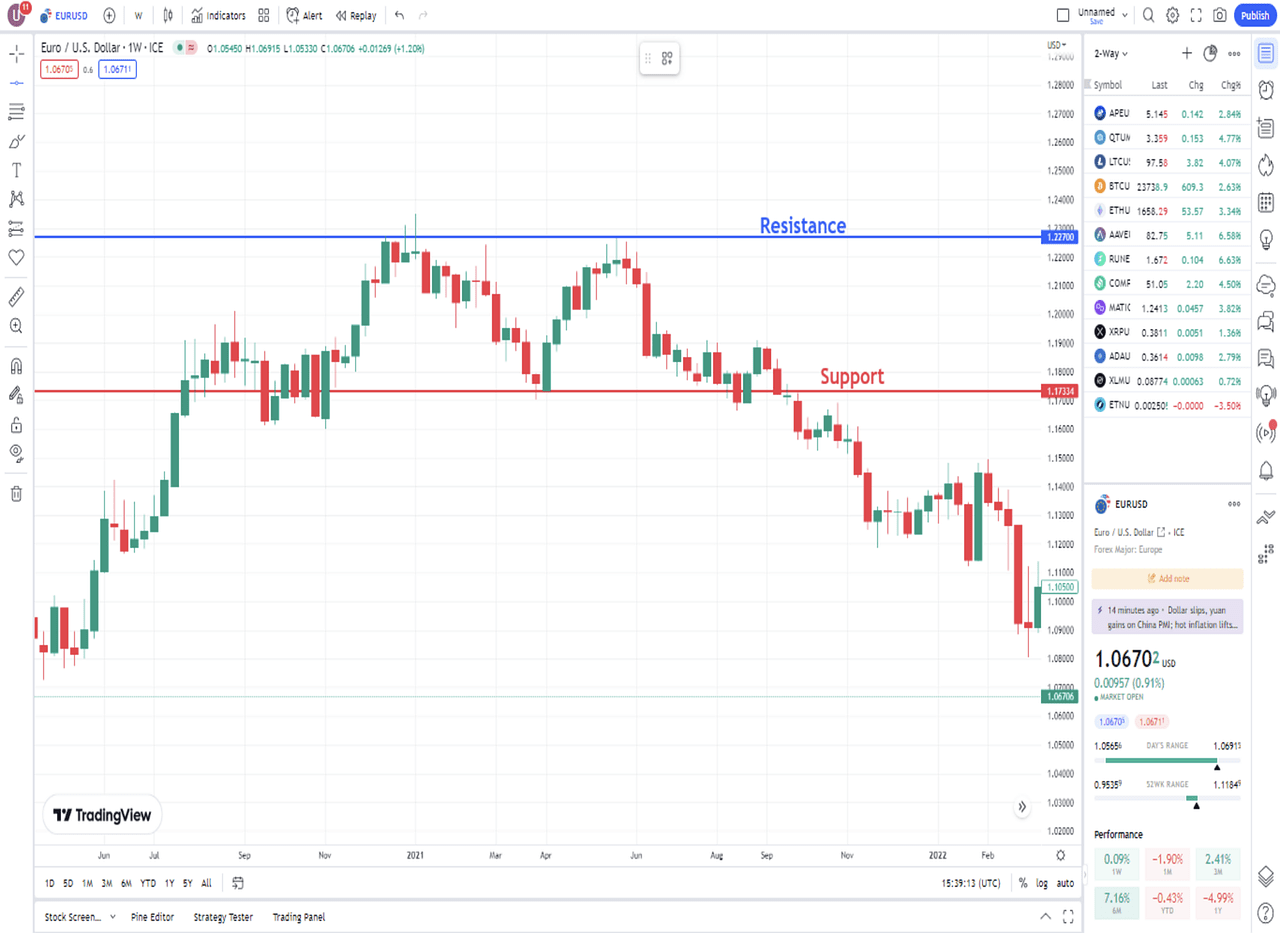
Crypto Heat Map
A heat map or performance grid shows how different digital currencies are doing in the market. This tool works well for new investors because it uses colors to show which coins are making money or losing value. The color system is easy to understand: Bright colors mean significant price increases, while darker colors show price drops. This lets you see what's happening across the cryptocurrency market and spot essential patterns.
How to Set Up the Heat Map
- Go to “Screeners” on TradingView and select “Heat Maps,” then choose “Crypto.”
- Adjust the timeline (24 hours, 7 days, 30 days) to analyze short-term or long-term trends. Set the size to “Market Cap” for a more accurate representation.
After identifying the performing coins, analyze the sectors. There could be a trend, as DeFi or Layer 1 tokens could be gaining momentum. However, the use of the heat map isn't enough. You should integrate other technical indicators, as they help you time your trades better.
Crypto Screener
Like a screen filter that separates particles based on their components, the crypto screener helps separate crypto based on specific criteria. This includes customizable criteria such as price, volume, and technical ratings. Using the screener, you can identify numerous trading opportunities in a crowded market of over 21,000 cryptocurrencies.
How to Set Up the Crypto Screener
- Click on “Screeners” and select “Crypto Screener.”
- To narrow your search, set filters for volume, price change, RSI, MACD, or custom technical ratings.
By applying the screener, you can easily identify breakouts. You can also use TradingView’s built-in technical ratings to identify bullish and bearish crypto projects, irrespective of market sentiment. This helps you make better decisions for your portfolio.
There's also the opportunity to backtest and monitor. All you have to do is save your screener settings and monitor them regularly to catch early moves before the rest of the market.
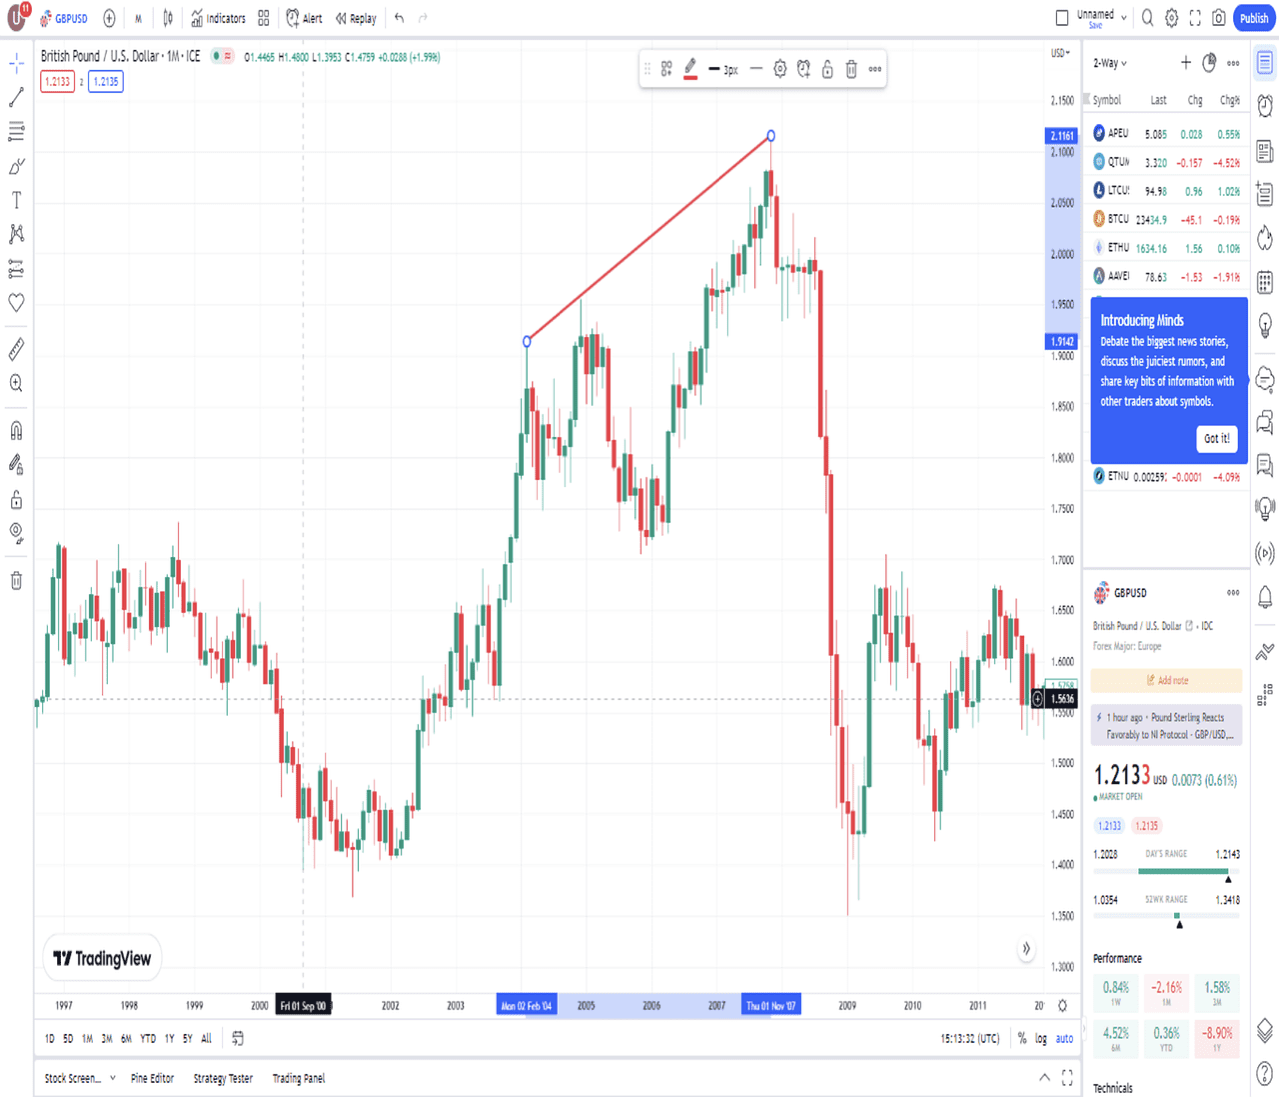
Pivot Points High Low
The Pivot Points High-Low indicator helps traders spot areas where prices might change direction. It marks possible turning points on a chart by looking at how prices moved before and after a certain point. A Pivot Point High happens when a price bar has a set number of lower bars on both sides. A Pivot Point Low forms when a price bar has a set number of higher bars on both sides.
A Pivot Point is more significant when it follows a longer trend. Extensive periods before and after the pivot point can highlight its importance. Pivot Points also help traders analyze price reversals and patterns, improving their ability to predict trends and identify optimal levels for drawing support or resistance.
How to Set Up Pivot Points High Low
- Search for “Pivot Points High Low” in TradingView’s indicator library.
- Configuration: The 20-20-20 setting (20 periods for high, low, and lookback) is popular for highlighting reliable zones.
Volume Footprint Delta
This trading indicator shows the difference between buying and selling volume at specific price levels within a candlestick or bar. In summary, volume footprint delta reverses the true intent behind price moves.
Volume footprint charts display this delta information alongside the price and volume data, often using color-coding. The positive delta (green) indicates a bullish movement as the buying volume exceeds the selling volume. The negative delta (red) is the opposite, with the selling volume exceeding the buying volume.
How to Set Up Volume Footprint Delta
- Add it from the indicator library if you have a Pro+ or Premium account.
- Install a volume footprint indicator. Search for “Footprint” or “Delta Footprint”
- Use a lower timeframe, like 5 minutes, for clearer delta data visibility.
- Adjust the aggregation period and color scheme to match your trading style
- Analyze the chart — track order flow strength around key levels.
Essential Tips Before You Start Trading
Proper application is key when using the top 5 indicators reviewed in this guide. It's advisable to merge these tools to increase profitability. However, you must be careful, as the crypto market is highly volatile. Before executing a trade or investment, it's best to research the cryptocurrency project. Novice traders can seek professional advice. However, the final decision should be based on your analysis.
 Watchlist
 Ads
Ads Boosts
 Today's best
 All time Best
 New listings
 Airdrops
 Presales
 Submit coin
 Contact Us
 Blog
Blog Dictionary
 Bitcoin Halving
 Partners
 KYC verification
 AMA hosting


